OpenResponses API
Observability
Monitor and track performance of your OpenResponses deployment
Observability
OpenResponses delivers enterprise-level observability out of the box, with zero configuration required to start collecting telemetry data across multiple dimensions.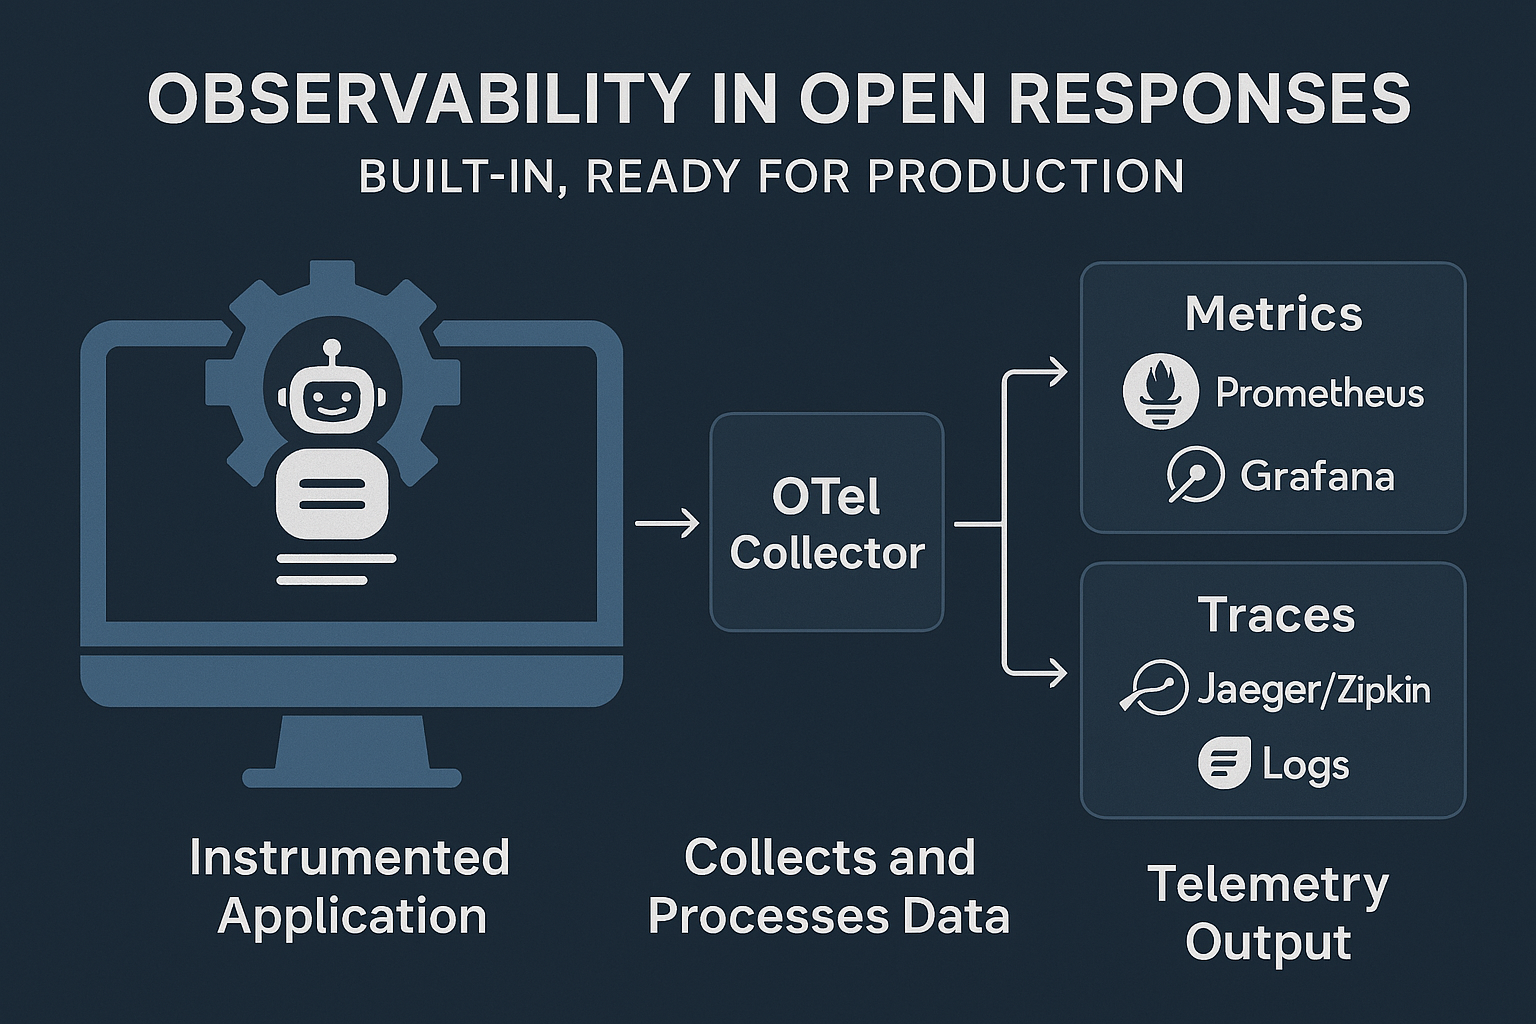
Production-Grade Observability
- Launch and Monitor: Start tracking critical GenAI metrics the moment your service goes live
- No Instrumentation Burden: Skip weeks of custom instrumentation work with pre-built telemetry
- Immediate Insights: Gain instant visibility into model performance, token usage, and system health
- Scale with Confidence: Production-ready monitoring that grows with your deployment
Overview
OpenResponses uses OpenTelemetry standards to instrument:- Model API calls across all providers
- Built-in tool executions
- Message content (user, system, assistant, and choices)
- Token usage metrics
- Performance metrics for various operations
Key Components
The primary component responsible for telemetry is theTelemetryService.
This service provides methods to:
- Create and manage observations (spans)
- Record metrics
- Emit GenAI-specific events
- Track token usage
Metrics
You can view the collected metrics in any metrics tool (like Prometheus) The system produces the following key metrics:| Metric Name | Description |
|---|---|
execute_tool | Measures internal tool execution performance |
gen_ai_client_operation_duration | Tracks duration of model API calls |
gen_ai_client_token_usage | Counts input and output token usage |
Traces
The system creates traces for:- HTTP POST requests to
/v1/responsesor/chat/completions - Model response generation via
{gen_ai.operation.name} {gen_ai.request.model} - Built-in tool execution via
execute_tool
How to Export Telemetry Data
OpenResponses is designed to work with the OpenTelemetry ecosystem for exporting telemetry data to various backends.Setting Up the OpenTelemetry Collector
-
To enable the OpenTelemetry collector integration, start the service with:
- The OpenTelemetry collector collects data from the service using OTLP (OpenTelemetry Protocol).
- Configuration of the collector is done via its config file, typically located in the deployment environment.
- All opentelemetry sdk-environment-variables are supported.
Exporting to Monitoring Tools
The collected data can be shipped to various monitoring tools:- For Metrics: Prometheus and Grafana
- For Traces: Jaeger, Zipkin, or other tracing backends
- For Logs: plug your own log aggregation systems
Observability in Action
Below are some examples of the observability insights available in OpenResponses:Distributed Tracing with Conversation Logs
The following image shows distributed tracing of a Brave search agent with streaming, including the complete conversation logs: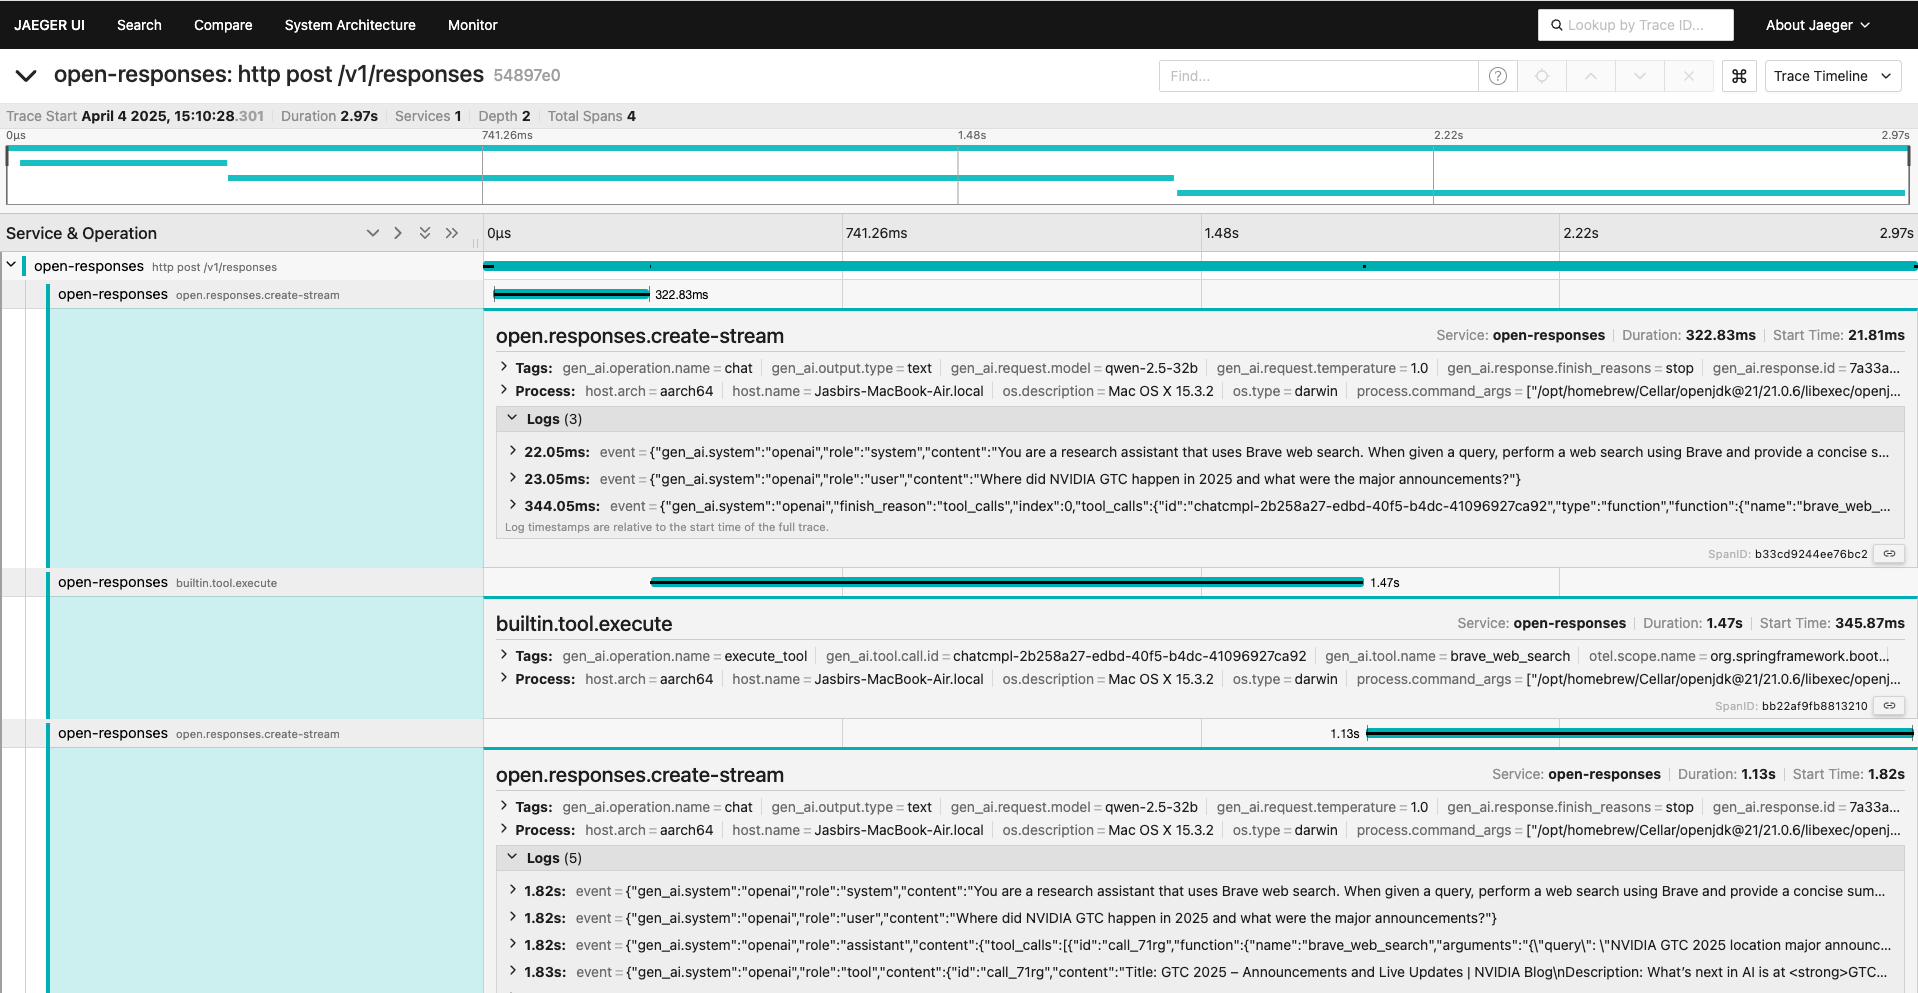
GenAI Performance Metrics
This dashboard displays token usage and model performance metrics: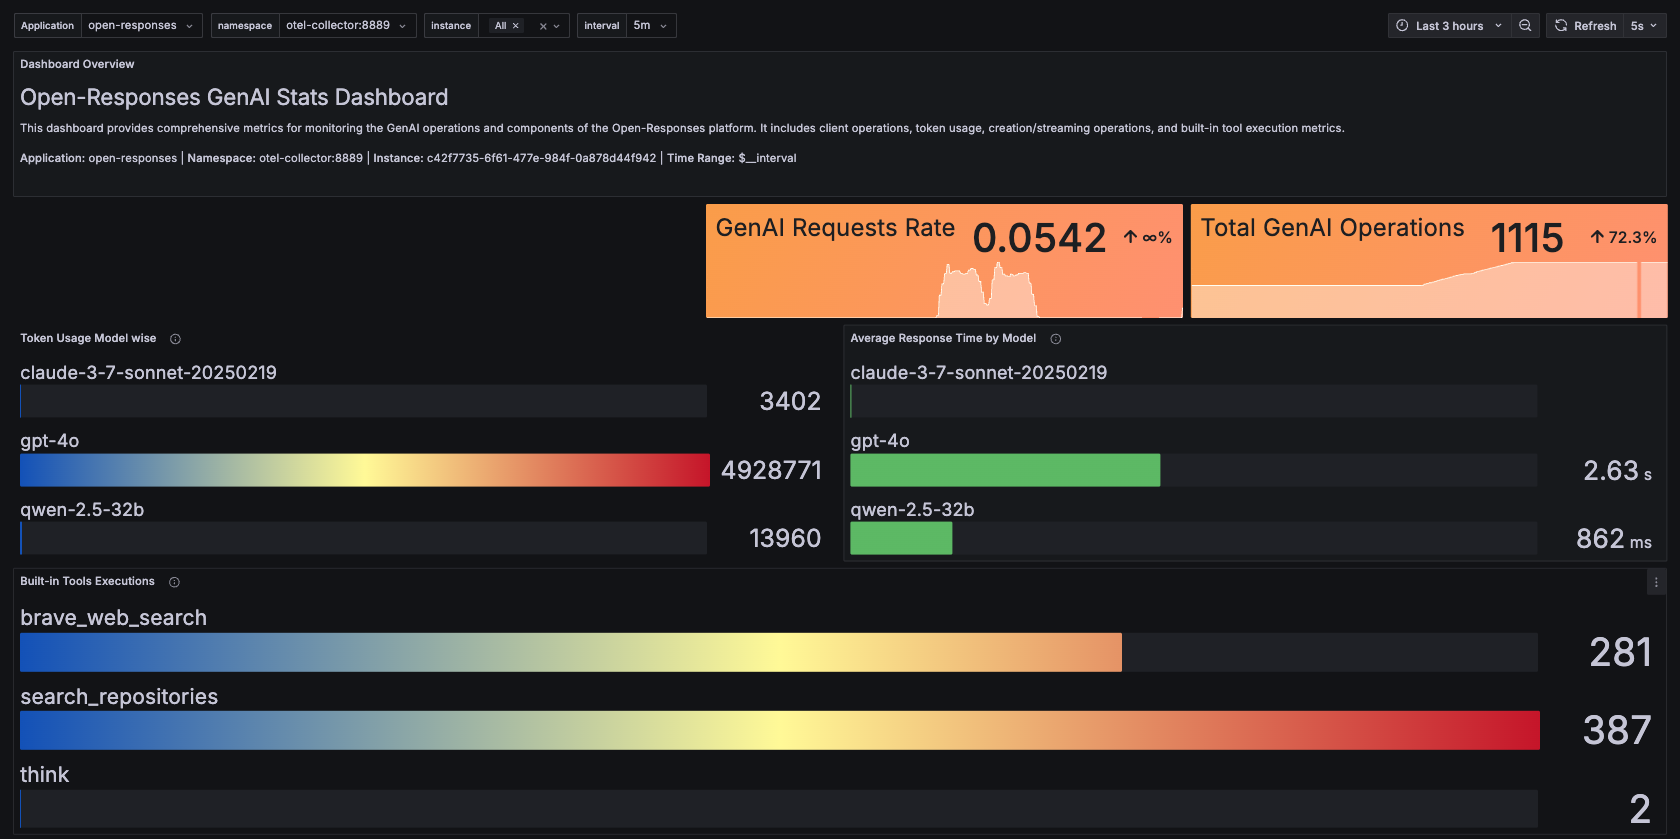
System Health Monitoring
Monitor the overall health and performance of your OpenResponses service: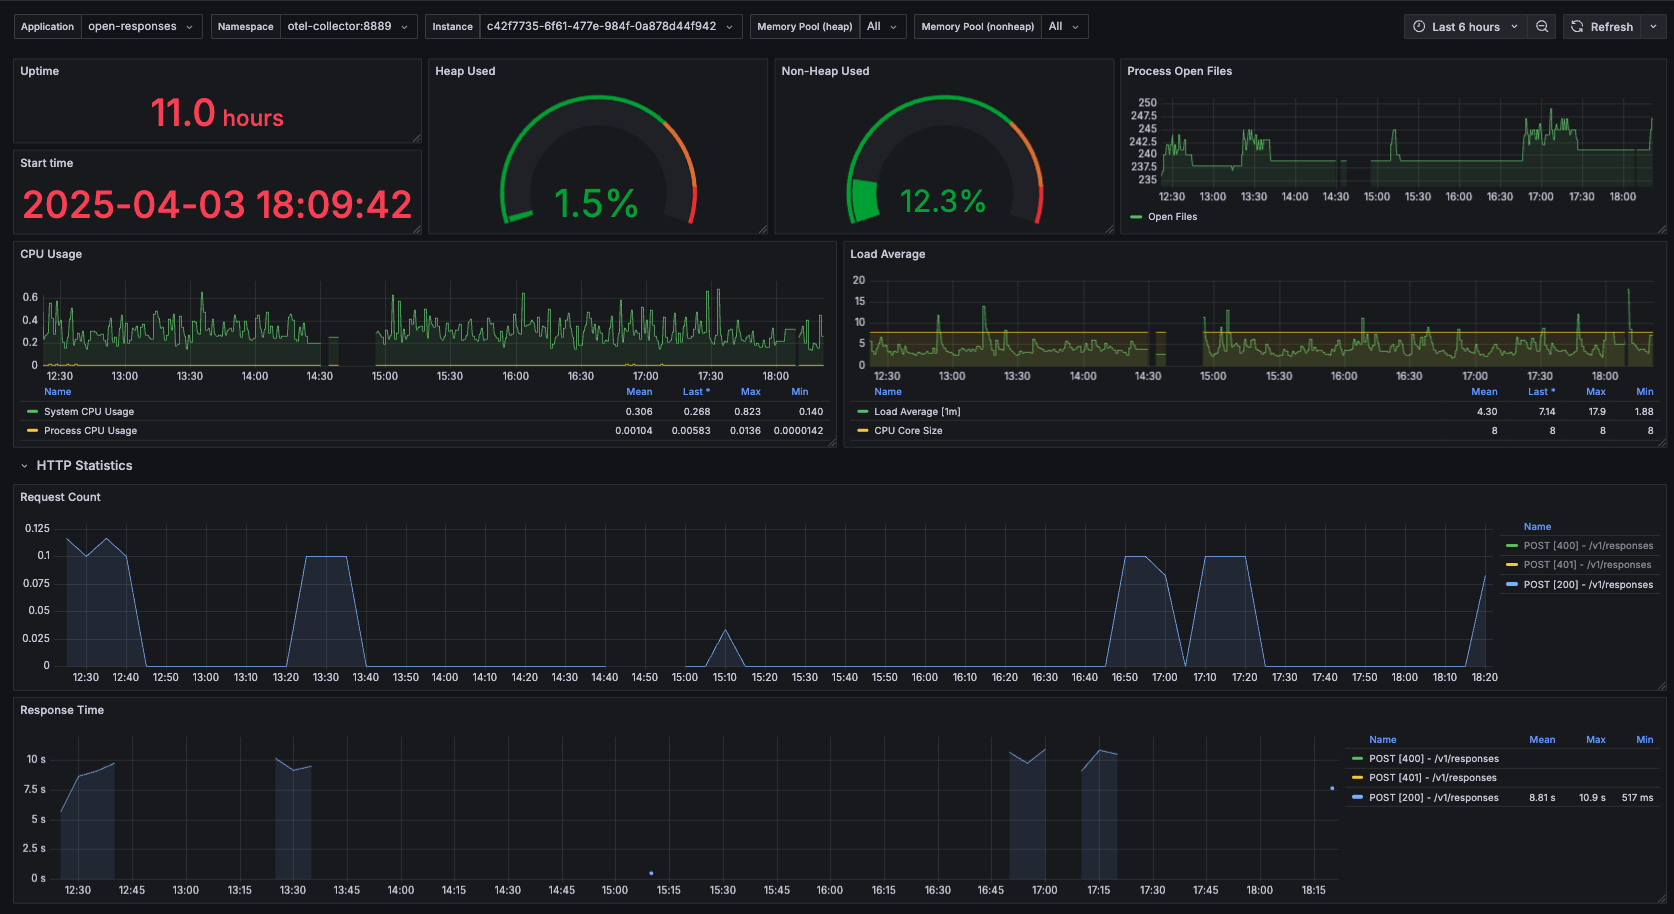
Standard Metrics
In addition to GenAI-specific observability, OpenResponses emits standard Spring Boot metrics, including:- JVM statistics (memory usage, garbage collection)
- HTTP request metrics (response times, error rates)
- System metrics (CPU usage, disk I/O)
- Logging metrics
- Thread pool statistics
OpenTelemetry Compatibility [WIP: For complete compliance with OTEL Specs]
The built-in observability system in OpenResponses follows opentelemetry specifications. This allows you to:- Use SigNoz, Jaeger, or Dynatrace for distributed tracing
- Implement Prometheus and Grafana for metrics and dashboards
- Integrate with OpenTelemetry-compatible GenAI evaluation stacks like LangFuse
OpenTelemetry Compliance
The implementation follows OpenTelemetry specifications for:- Spans: GenAI Agent Spans
- Metrics: GenAI Metrics
- Events: GenAI Events
OpenTelemetry span attributes that are under implementation are:
- gen_ai.request.choice.count
- gen_ai.request.seed
- gen_ai.request.frequency_penalty
- gen_ai.request.presence_penalty
- gen_ai.request.stop_sequences
- gen_ai.request.top_k